< Change image left
White-Light
Magnetogram

< Polarity drawing
|
|
< Change image left
White-Light
Magnetogram |
|
|
< Polarity drawing
|
|
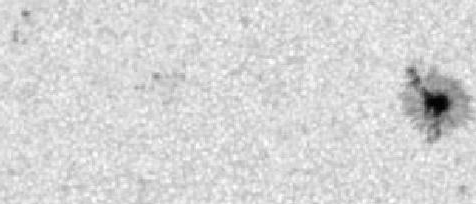
Description:
Upper panel: Image of the sunspot group as seen in the actual white-light or by magnetic observation of SDO/HMI. Make your choice by the radio button on the right. Lower panel: Synthetic polarity drawing of the sunspot group to illustrate the data content of HMIDD. It is created from the position and area data of spots, derived from the observations above. The spots (and pores) are represented with ellipses visualising approximately the spot roughy as a projection of a circle on a sphere onto a plane. The centroid of the ellipse is at the position of the visible centroid of the spot. The area of the ellipse is the projected whole spot area (WS). The umbra (U) is represented with a smaller ellipse within the ellipse of spot. The colors of the ellipses of umbra and penumbra show the polarities of their mean magnetic field derived from the magnetogram (light-gray penumbra and white umbra: positive, dark-gray penumbra and black umbra: negative). At least a small part of the spot is always colored in white or black (even if U=0) to emphasize the polarity information. In the case of several umbrae in common penumbra, there is an umbral ellipse for each umbra at its position. In the case of mixed polarities, the colors of umbra and penumbra may show opposite polarities ( see an example here). If you move the mouse cursor over a sunspot (or umbra) near its centroid in the upper or lower panel, the actual related data row of that sunspot will pop up on the row between the upper and lower panels. |