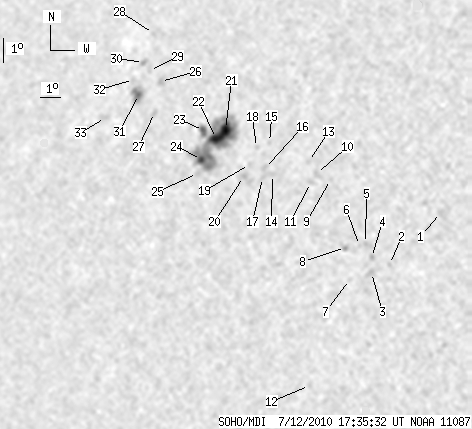
SOHO MDI 2010-07-12 17:35:32 UT
| group | Proj. U | Proj. WS | Corr. U | Corr. WS | B | L | LCM | Pos. angle | r | MU | MP |
| 37 | 417 | 23 | 263 | 20.75 | 333.91 | -34.78 | 60.65 | 0.6125 | -310.3 | -12.1 | |
|
previous
or next day for the same group /
back to the solar disc SOHO MDI 2010-07-12 17:35:32 UT |
| spot | Proj. U | Proj. WS | Corr. U | Corr. WS | B | L | LCM | Pos. angle | r | MU | MP |
| 0 | 10 | 0 | 6 | 18.37 | 344.79 | -23.89 | 56.60 | 0.4623 | -824.0 | -547.9 | |
| 0 | 3 | 0 | 2 | 16.20 | 342.78 | -25.91 | 62.59 | 0.4746 | -763.0 | -550.7 | |
| 0 | 10 | 0 | 5 | 15.85 | 342.00 | -26.69 | 63.86 | 0.4832 | -868.0 | -677.0 | |
| 0 | 6 | 0 | 3 | 16.46 | 341.91 | -26.78 | 62.76 | 0.4879 | -826.0 | -573.4 | |
| 0 | 7 | 0 | 4 | 17.01 | 341.55 | -27.14 | 61.98 | 0.4961 | -843.0 | -642.4 | |
| 0 | 2 | 0 | 1 | 16.92 | 341.28 | -27.41 | 62.35 | 0.4991 | -260.0 | -349.4 | |
| 0 | 1 | 0 | 1 | 15.54 | 341.03 | -27.66 | 65.14 | 0.4949 | -449.0 | -427.0 | |
| 0 | 4 | 0 | 2 | 16.82 | 340.64 | -28.04 | 63.00 | 0.5071 | -580.0 | -479.3 | |
| 0 | 3 | 0 | 2 | 19.57 | 339.44 | -29.25 | 59.03 | 0.5391 | -535.0 | -473.7 | |
| 0 | 8 | 0 | 5 | 19.79 | 338.71 | -29.97 | 59.18 | 0.5495 | -466.0 | -498.2 | |
| 0 | 6 | 0 | 3 | 19.41 | 338.50 | -30.19 | 59.96 | 0.5500 | -49.0 | -156.3 | |
| 0 | 4 | 0 | 3 | 11.23 | 339.73 | -28.96 | 74.24 | 0.4954 | -577.0 | -445.1 | |
| 0 | 3 | 0 | 2 | 20.27 | 338.22 | -30.47 | 58.74 | 0.5586 | -555.0 | -558.8 | |
| 0 | 5 | 0 | 3 | 19.68 | 336.58 | -32.11 | 60.79 | 0.5756 | 792.0 | 711.8 | |
| 0 | 3 | 0 | 2 | 20.98 | 336.12 | -32.57 | 59.01 | 0.5885 | 771.0 | 559.4 | |
| 0 | 4 | 0 | 3 | 19.91 | 336.12 | -32.56 | 60.70 | 0.5825 | 458.0 | 526.8 | |
| 0 | 4 | 0 | 3 | 19.53 | 336.11 | -32.58 | 61.31 | 0.5807 | 791.0 | 684.2 | |
| 0 | 4 | 0 | 2 | 20.75 | 335.52 | -33.17 | 59.74 | 0.5945 | 202.0 | 179.8 | |
| 0 | 2 | 0 | 2 | 20.04 | 335.34 | -33.35 | 60.96 | 0.5929 | 618.0 | 509.0 | |
| 0 | 18 | 0 | 11 | 19.54 | 335.15 | -33.53 | 61.86 | 0.5926 | 600.0 | 548.8 | |
| 12 | 236 | 8 | 149 | 21.44 | 333.75 | -34.94 | 59.75 | 0.6194 | -1307.8 | -195.4 | |
| 13 | -21 | 8 | -21 | 21.05 | 333.39 | -35.30 | 60.53 | 0.6217 | -1142.9 | 999999 | |
| 4 | -21 | 3 | -21 | 21.35 | 332.62 | -36.07 | 60.50 | 0.6323 | -735.4 | 999999 | |
| 4 | -21 | 2 | -21 | 20.15 | 332.85 | -35.84 | 62.17 | 0.6238 | 1099.9 | 999999 | |
| 0 | 5 | 0 | 3 | 19.57 | 332.79 | -35.90 | 63.08 | 0.6218 | 488.0 | 425.9 | |
| 0 | 7 | 0 | 5 | 23.29 | 329.68 | -39.00 | 59.23 | 0.6751 | 803.0 | 621.3 | |
| 0 | 6 | 0 | 4 | 21.99 | 329.79 | -38.90 | 61.00 | 0.6680 | 783.0 | 699.5 | |
| 0 | 3 | 0 | 2 | 25.28 | 328.54 | -40.15 | 57.09 | 0.6968 | 644.0 | 597.8 | |
| 0 | 9 | 0 | 6 | 23.72 | 328.91 | -39.78 | 59.01 | 0.6856 | 561.0 | 395.9 | |
| 0 | 5 | 0 | 3 | 24.04 | 328.45 | -40.23 | 58.80 | 0.6920 | 526.0 | 411.1 | |
| 4 | 25 | 2 | 17 | 22.69 | 328.66 | -40.03 | 60.54 | 0.6838 | 1164.4 | 791.4 | |
| 0 | 5 | 0 | 3 | 23.30 | 328.16 | -40.53 | 59.93 | 0.6920 | 237.0 | 352.4 | |
| 0 | 9 | 0 | 6 | 21.66 | 327.16 | -41.53 | 62.61 | 0.6963 | 777.0 | 580.0 | |
| Proj. U | - Projected umbra area in millionths of solar disc, negative values indicate | |
|
that the umbra consists of fragmented regions which cannot be separated without losing umbral area. In this way several spots (intensity minima in the umbra) have a common umbra, e.g. -2 means that the given spot shares an umbra with spot No.2, and the common U value is indicated at spot No.2. |
||
| Proj. WS | - Projected umbra + penumbra area in millionths of solar disc, negative values indicate | |
|
that several umbras have a common penumbra, e.g. -7 means that the given umbra shares a penumbra with umbra No.7, and the WS value is indicated at No.7. |
||
| Corr. U | - Corrected umbra area in millionths of solar hemisphere, for negative values see above | |
| Corr. WS | - Corrected umbra + penumbra area in millionths of solar hemisphere, for negative values see above | |
| B | - Heliographic latitude B; positive: North, negative: South | |
| L | - Heliographic longitude L | |
| LCM | - Longitudinal distance from the Sun's central meridian | |
| Pos. angle | - Position angle | |
| r | - Distance from the centre of Sun's disc in terms of Sun's radius | |
| MU | - Mean magnetic field within the umbra contour averaged the pixel values with sign. | |
| MP | - Mean magnetic field within the penumbra contour averaged the pixel values with sign. | |